
Part 2 of a 3-part ISAP series on biofuel carbon intensity for Illinois corn and soybean farmers
By Bonnie McGill, Jean Brokish, and Ben Wiercinski (American Farmland Trust)
This series of blog posts explains what is known and unknown regarding CI scores for corn and soybean farmers. This series pulls from our conversations with several experts, the latest government rules and tools, and the literature. We hope it helps bring you up to speed on CI scores and what questions we all need to keep asking.
In June 2026 the USDA released their final rule on how they will account for the CI of biofuel feedstock crops. The rule contained several new pieces of information relevant to farmers.
The final rule: Mass balance
USDA will use a mass balance traceability system rather than a book and claim system. A book and claim system would have enabled any US grower to participate but would require the establishment of a registry and marketplace for claim transactions. Mass balance means that the CI score physically travels with the grain through the supply chain, but the identity is not physically separated from other grain such as with organic grain. Grain aggregators keep track of the proportions of grain CI scores combined in an elevator. These proportions are tracked through the supply chain. Mass balance likely limits participation to growers located near biofuel plants and elevators in the biofuel supply chain.
The final rule: A new calculator
The final rule also came with an updated Feedstock CI Calculator (FD-CIC) for farmers to estimate the CI of field corn, soybeans, sorghum, and spring canola. The tool is available as an excel spreadsheet or web-based tool. The calculator requires growers to provide total nitrogen (N) fertilizer used, actual crop yield, and expected crop yield (used in case of a crop failure). Growers also provide details on their use of management practices that may lower their CI: cover crop, tillage type, nitrification inhibitor, and manure application. Figure 1 explains the different components of a CI score for corn.
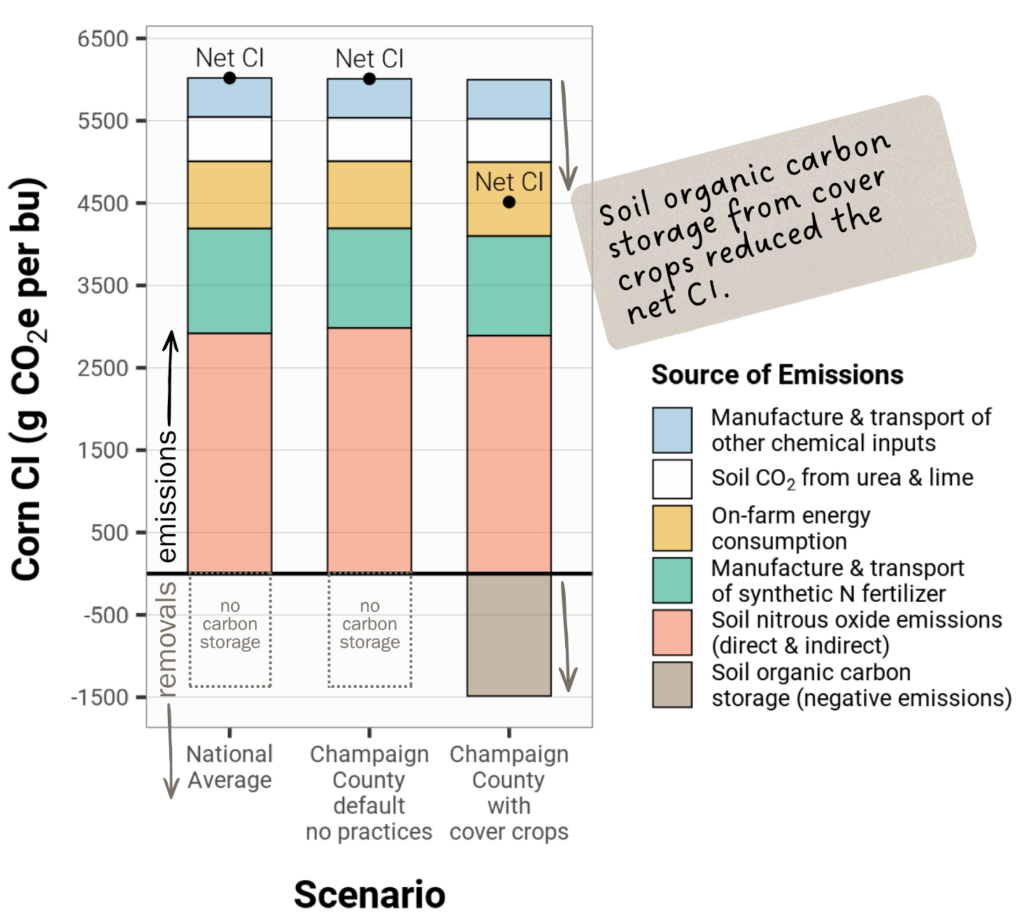
Figure 1. Components of carbon intensity in the USDA’s national average estimate for corn compared to a corn field in Champaign County, Illinois without low carbon practices and with cover crops according to the USDA Feedstock CI Calculator. Soil organic carbon storage with cover crops reduced the corn CI by 25%. See the Notes section in the full report for calculator inputs and unit conversion details.
The final rule: Tillage
When a no-till farmer provides their CI score to the buyer they will have to provide an attestation that they “will continue no-till on all crops in the rotation for a minimum of four out of every five years” (Technical Guidelines § 2100.031) in order for the estimated soil carbon storage benefit to match assumptions in the FD-CIC model. In other words, if a producer includes no-till in their CI score calculation but tills more than once in the next five years, the CI score would be artificially low.
Tillage type chosen in the CI Calculator is now dictated by a separate scoring tool called T-DISC, which scores a field’s tillage based on the intensity of field operations to ensure consistent tillage classifications across farms. In T-DISC, knifing in liquid manure or fertilizer moves a “No-till” field to “Reduced till,” which impacts the CI score. According to results averaged across 15 Illinois counties (see Notes in the full report), a no-till field reduces corn CI by about 2,100 g CO2e per bu compared to the USDA national average corn CI, whereas reduced tillage only decreases the corn CI by about 480 g CO2e per bu (Figure 2).
Farmers considering switching to surface application to qualify as no-till in T-DISC are encouraged to consider the water quality benefits of incorporating manure and other fertilizers over surface application.
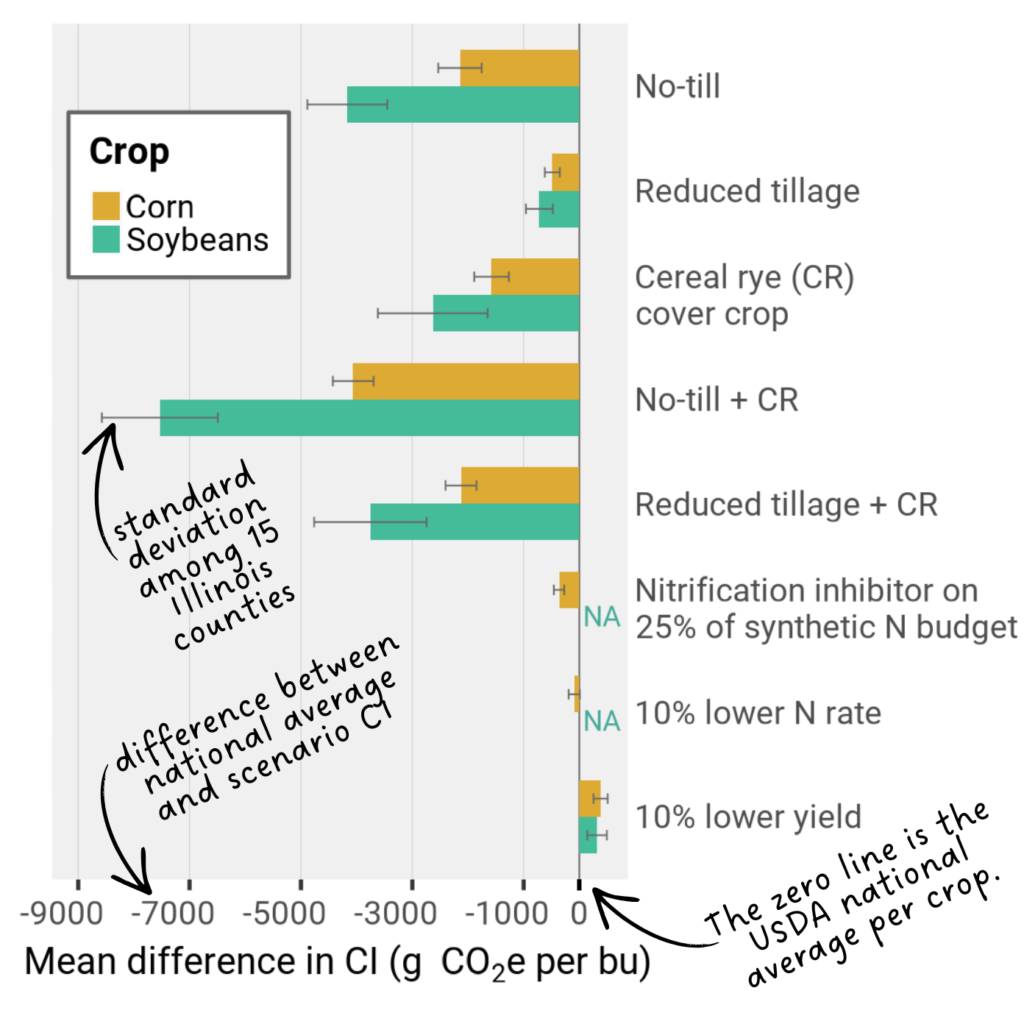
Figure 2. We ran various scenarios in the USDA Feedstock CI Calculator for 15 Illinois counties. Then we subtracted the scenario CI from the national average CI for corn (yellow) and soybeans (green) and calculated the mean across the counties. Error bars indicate the standard deviation among the counties. The USDA national average CIs (zero line) are 6,020 g CO2e per bu corn and 7,682 g CO2e per bu soybeans. See the Notes section in the full report for calculator inputs and unit conversion details.
The final rule: Manure
Substituting manure for part of the total N budget reduces the CI score by about 2-7% depending on manure amount, type, and N content. This reduction is due to slightly lower emissions from manufacture and transport of the manure and lower CO2 emissions from lime for manure N compared to synthetic N fertilizer. In the calculator, manure nitrous oxide emissions and soil C storage are no different than a scenario using the same amount of N as synthetic N fertilizer.
The final rule: Record keeping
The final rule states that a producer selling a crop into a biofuel supply chain must:
- Have nutrient management recordkeeping that includes several components, including a nutrient budget demonstrating crop nutrient needs for N-P-K and a recent soil test or professional opinion.
- Provide the first point of aggregation (the entity buying from the farmer) with a Biofuel Feedstock Report (what the Report must include § 2100.031(e)).
- Keep records that a third party verifier can use in the case that they are audited at the first point of aggregation in a supply chain (elevator, processor, plant, etc). Farmers may, but are not required to, get their records verified by a third party independently.
Here we have summarized some of the most relevant rules for Illinois corn and soybean farmers to participate in a 45Z program, including the mass balance traceability system, new calculator, tillage considerations, how manure can count toward CI, and record keeping. In Part 3, we’ll explain why, at this time, it’s hard to say what a farmers’ payment will be for a given CI score.
The full series:
- Part 1: What is a CI score and why do corn and soybeans have different scores?
- Part 2: What is known about CI scores and how farmers can get involved
- Part 3: What we don’t know about how farmers will get paid for low CI feedstock crops
We have also pulled all this information together into one report you can download here.
We made this report because 45Z exists and some Illinois producers can take advantage of it, but we’re not endorsing 45Z as a solution for all farmers.
We thank the following reviewers:
Talon Becker, PhD, CCA (University of Illinois Urbana-Champaign Extension)
Preston Brown (incite.ag)
Megan Dwyer, CCA (IL Corn)
Dr. Scott Gerlt (American Soybean Association)
David Kubik (Illinois Soybean Association)
Casey Kula (American Farmland Trust)
