
Part 1 of a 3-part ISAP series on biofuel carbon intensity for Illinois corn and soybean farmers
By Bonnie McGill, Jean Brokish, and Ben Wiercinski (American Farmland Trust)
Welcome to this series of blog posts explaining what is known and unknown regarding CI scores for corn and soybean farmers. This series pulls from our conversations with several experts, the latest government rules and tools, and the literature. We hope it helps bring you up to speed on CI scores and what questions we all need to keep asking.
The basics
Carbon Intensity is an estimate of the greenhouse gas emissions associated with the materials and processes involved in creating a product. The Carbon Intensity (CI, sometimes referred to as CI score) of a biofuel is an estimate of the greenhouse gas emissions involved in the feedstock production and fuel conversion steps of a biofuel supply chain. The 45Z tax credit program is an incentive for biofuel plants to reduce their fuel’s CI relative to a national standard. Over 50% of the CI of corn ethanol or soybean biomass-based diesel can come from the crop (feedstock) production portion of the biofuel’s life cycle. Corn and soybean farmers can reduce their feedstock’s contribution to a plant’s overall CI score by increasing crop yield, reducing greenhouse gas emissions associated with crop production, and/or adding carbon to their soil via cover crops or conservation tillage. Figure 1, below, illustrates the components of feedstock carbon intensity. Corn and soybean farmers with low CI scores could stand to profit from the 45Z tax credits paid by the IRS to biofuel plants, but how much of that benefit will pass through the supply chain to farmers remains unclear (explained in Part 3, but we recommend you read Parts 1 and 2 first).
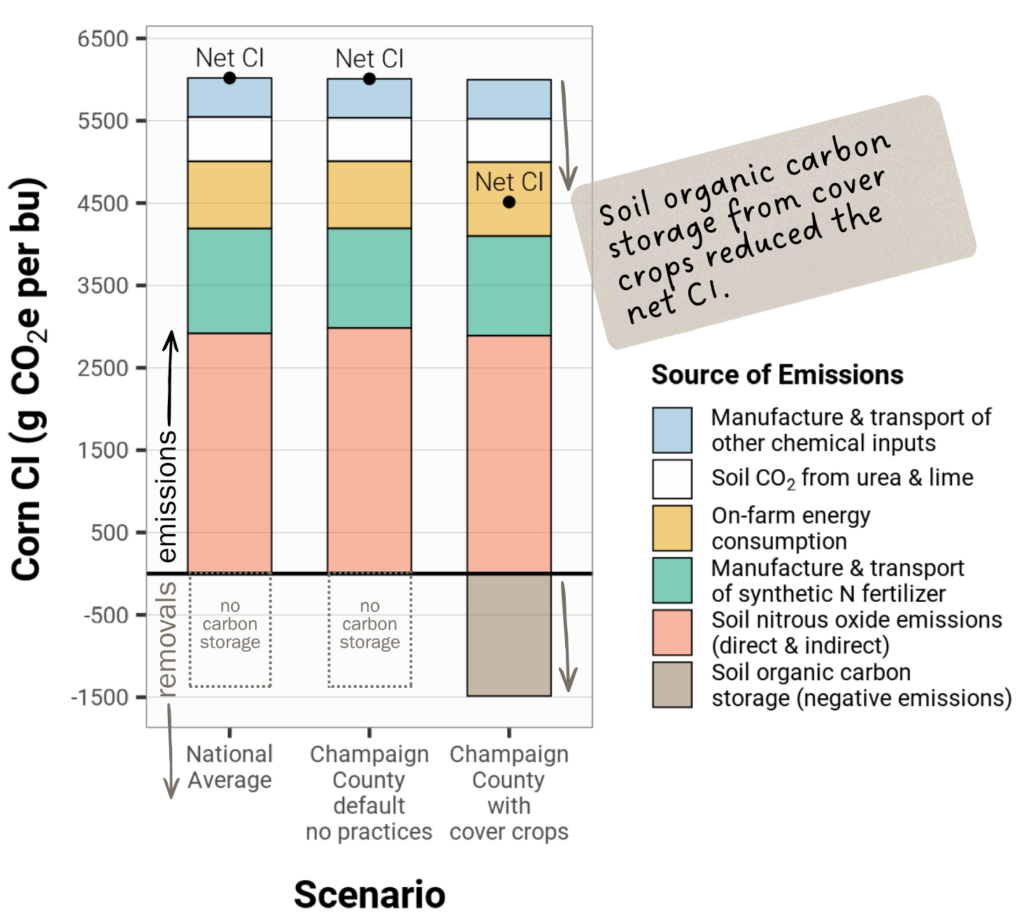
Figure 1. Components of carbon intensity in the USDA’s national average estimate for corn compared to a corn field in Champaign County, Illinois without low carbon practices and with cover crops according to the USDA Feedstock CI Calculator. Soil organic carbon storage with cover crops reduced the corn CI by 25%. See the Notes section in the full report for calculator inputs and unit conversion details.
Consider this when deciding if you’ll participate in 45Z
Unlike environmental market programs like the voluntary carbon market, practices do not have to be new or “additional” to an acre to count toward a CI score. This is good news for farmers who have already adopted cover crops and conservation tillage. Farmers who have not yet adopted these practices may want to weigh their options between 45Z and environmental market programs where additionality is required. Cropland acres earning a 45Z payment may not be eligible in the future for environmental market programs requiring additionality. The 45Z tax credit program expires at the end of 2029 but could be renewed. Producers may stack 45Z with cost-share programs like EQIP and CSP.
Comparing practices and corn and soybean carbon intensities
A crop’s CI is compared to the USDA-established national average for each crop, meaning crop CI is often expressed as the difference between the individual crop’s CI (remember: lower CI is better) and the national average. Figure 2, below, shows how different practice options available in the 45Z program affect corn and soybean CI scores across Illinois counties.
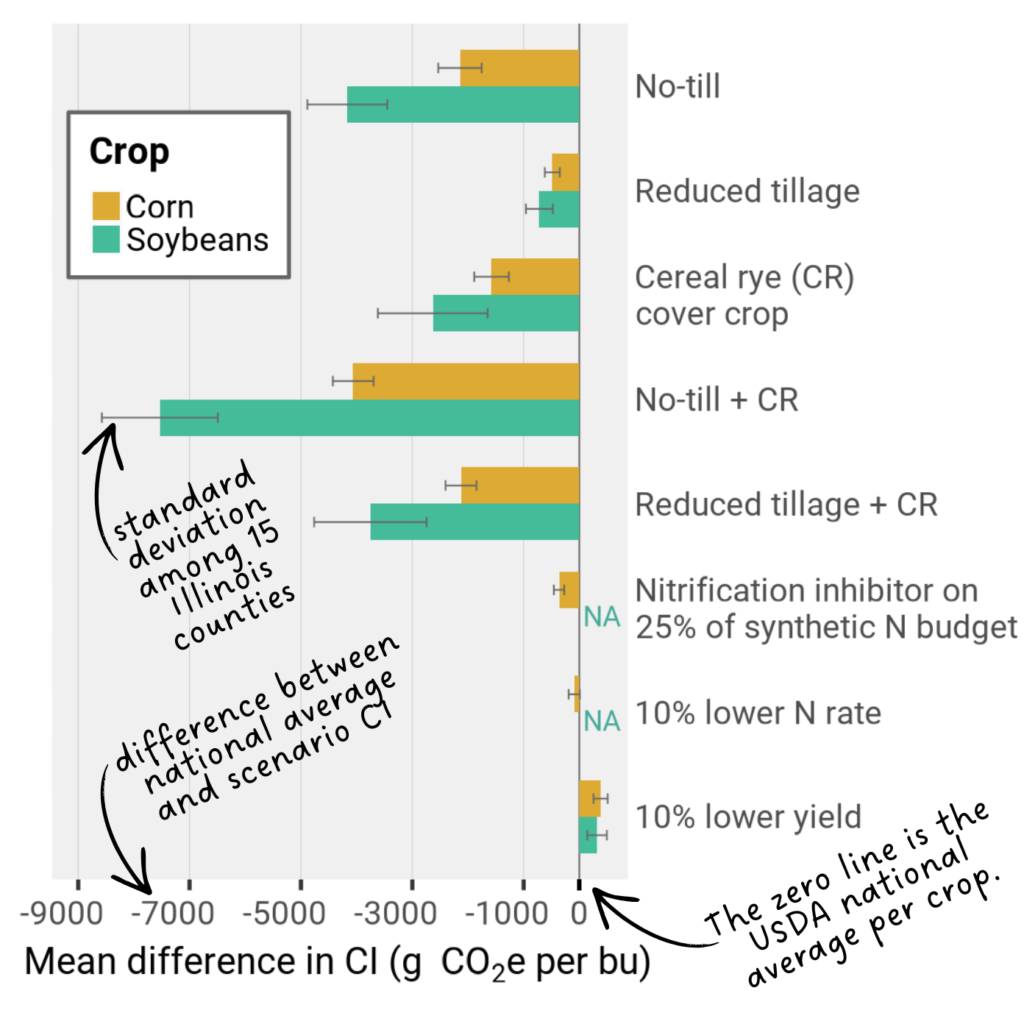
Figure 2. We ran various scenarios in the USDA Feedstock CI Calculator for 15 Illinois counties. Then we subtracted the scenario CI from the national average CI for corn (yellow) and soybeans (green) and calculated the mean across the counties. Error bars indicate the standard deviation among the counties. The USDA national average CIs (zero line) are 6,020 g CO2e per bu corn and 7,682 g CO2e per bu soybeans. See the Notes section in the full report for calculator inputs and unit conversion details.
Looking at Figure 2 you may wonder why soybeans have much greater CI differences compared to corn. Soybean yields are much lower than corn. So reductions in emissions per bushel are much larger for soybeans compared to corn. See the Notes section in the full report for more discussion on differences between corn and soybeans.
Because the field’s emissions are tied to crop yields, lower crop yields mean higher (worse) CI. In our calculations, a 10% yield loss increased CI by about 380 g CO2e per bu corn and about 320 g CO2e per bu soybean. In other words, for every one bushel yield loss, CI increased by about 18 g CO2e for corn and 6 g CO2e for soybeans. Biofuel plants will convert CI scores from g CO2e per bu to kg CO2e per unit energy or million BTUs (kg CO2e per mmBTU; conversions are provided in the Notes section in the full report).
In Part 1, we’ve covered the basics of CI, what contributes to a crop’s CI, how different practices impact the CI, and compared corn and soybean CI scores. In Part 2 we’ll explain the new rule from USDA explaining how farmers can get involved.
The full series:
- Part 1: What is a CI score and why do corn and soybeans have different scores?
- Part 2: What is known about CI scores and how farmers can get involved
- Part 3: What we don’t know about how farmers will get paid for low CI feedstock crops
We have also pulled all this information together into one report you can download here.
We made this report because 45Z exists and some Illinois producers can take advantage of it, but we’re not endorsing 45Z as a solution for all farmers.
We thank the following reviewers:
Talon Becker, PhD, CCA (University of Illinois Urbana-Champaign Extension)
Preston Brown (incite.ag)
Megan Dwyer, CCA (IL Corn)
Dr. Scott Gerlt (American Soybean Association)
David Kubik (Illinois Soybean Association)
Casey Kula (American Farmland Trust)
